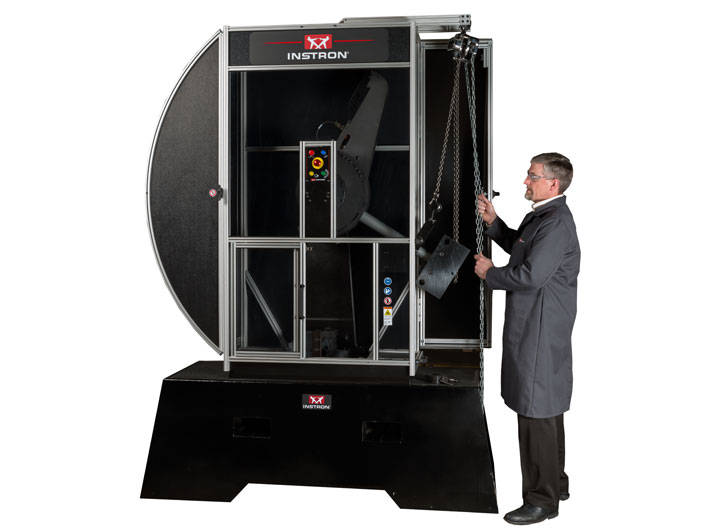
MPX SERIES PENDULUM
Pendulum Impact Test System Powered by Bluehill® Impact Software
The Instron MPX motorized pendulum impact test system with the new Bluehill Impact software is the preferred system for metals impact testing to Charpy and Izod standards. Available in capacities ranging from 300 to 900 Joules, the MPX is efficient and easy to operate, making it suitable for high volume testing. The testing space is fully enclosed and uses an integrated guard and safety control system that meets the stringent requirements for the European CE mark and ISO 13849 - offering exceptional protection for your operators.
Request a Quote or Demo
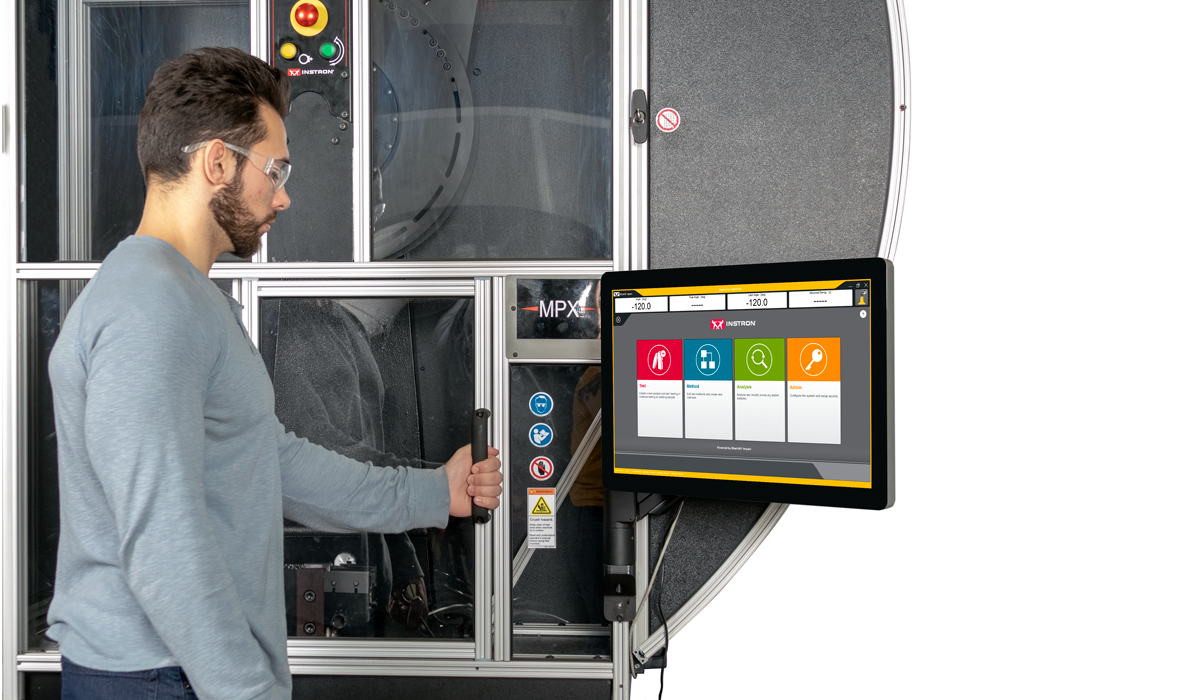
Safe | Versatile | Easy to Use
Features and Benefits
- Standard capacities include 300, 450, 600, 750, and 900 Joules
- Automatic test start at door closure for efficient testing and adherence to standards for non-ambient specimen testing
- Optional interchangeable hammer weights conveniently adjust the system capacity without removal of the hammer shaft
- Motorized hammer lift and automatic return to start test position for increased productivity and operator safety
- Hammer brake, clutch, and latch mechanisms respond quickly for faster operation
- Safety enclosure with interlocks protects the operator by preventing the hammer from releasing when doors are open
- Adjustable latch height adds configurability for testing at lower energies and velocities
- Standard base design meets ASTM and ISO recommendations
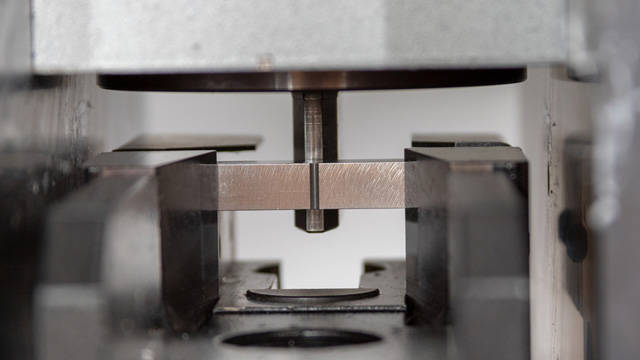
- Charpy anvil inserts and striker are selectable to meet a range of international test standards
- The MPX is designed to meet the following standards: ASTM E23, ISO 148, EN 10045, GOST 9454, AS 1544, JIS Z 2242, JIS B 7722
View Specifications
Powerful New Software for Impact Testing
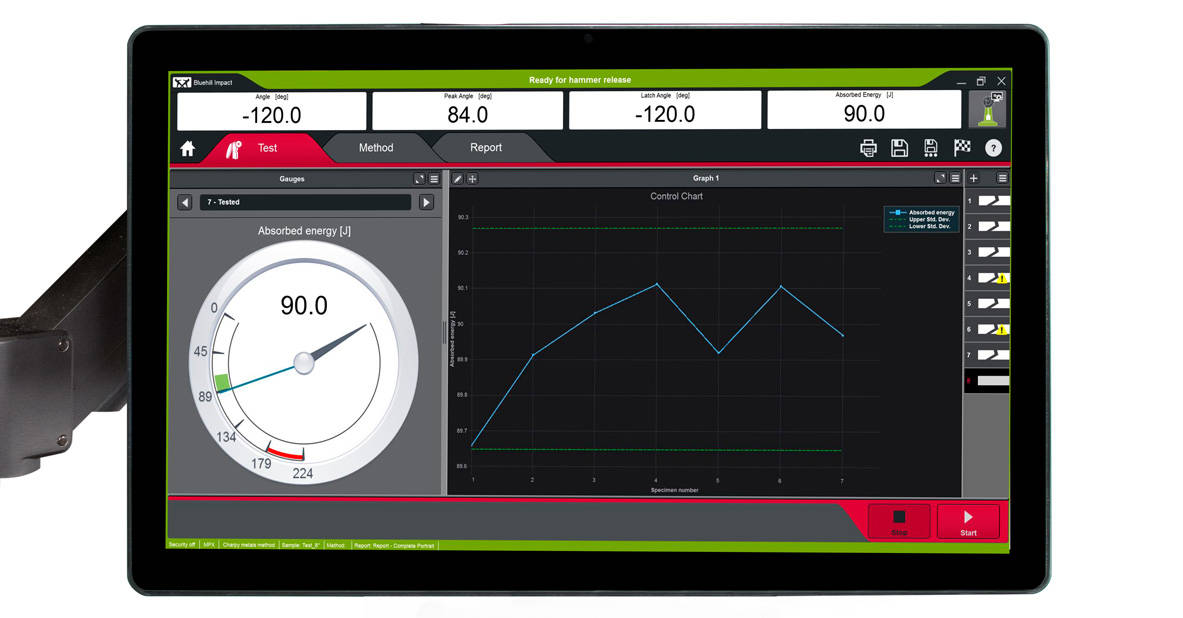
Built on our popular and adaptive Bluehill platform, Bluehill Impact is Instron’s newest and most powerful impact testing software. Bluehill Impact is designed for touch interaction through its meticulously-crafted visual interface, featuring large touchpoints and intuitive gestures to make the user experience simpler and smarter than ever before. Bluehill Impact not only increases the power and flexibility found in previous versions of Instron’s impact testing software, it also boasts many advanced capabilities such as pre-loaded test methods, real-time analog dials with digital data, and enhanced reports and data exporting.
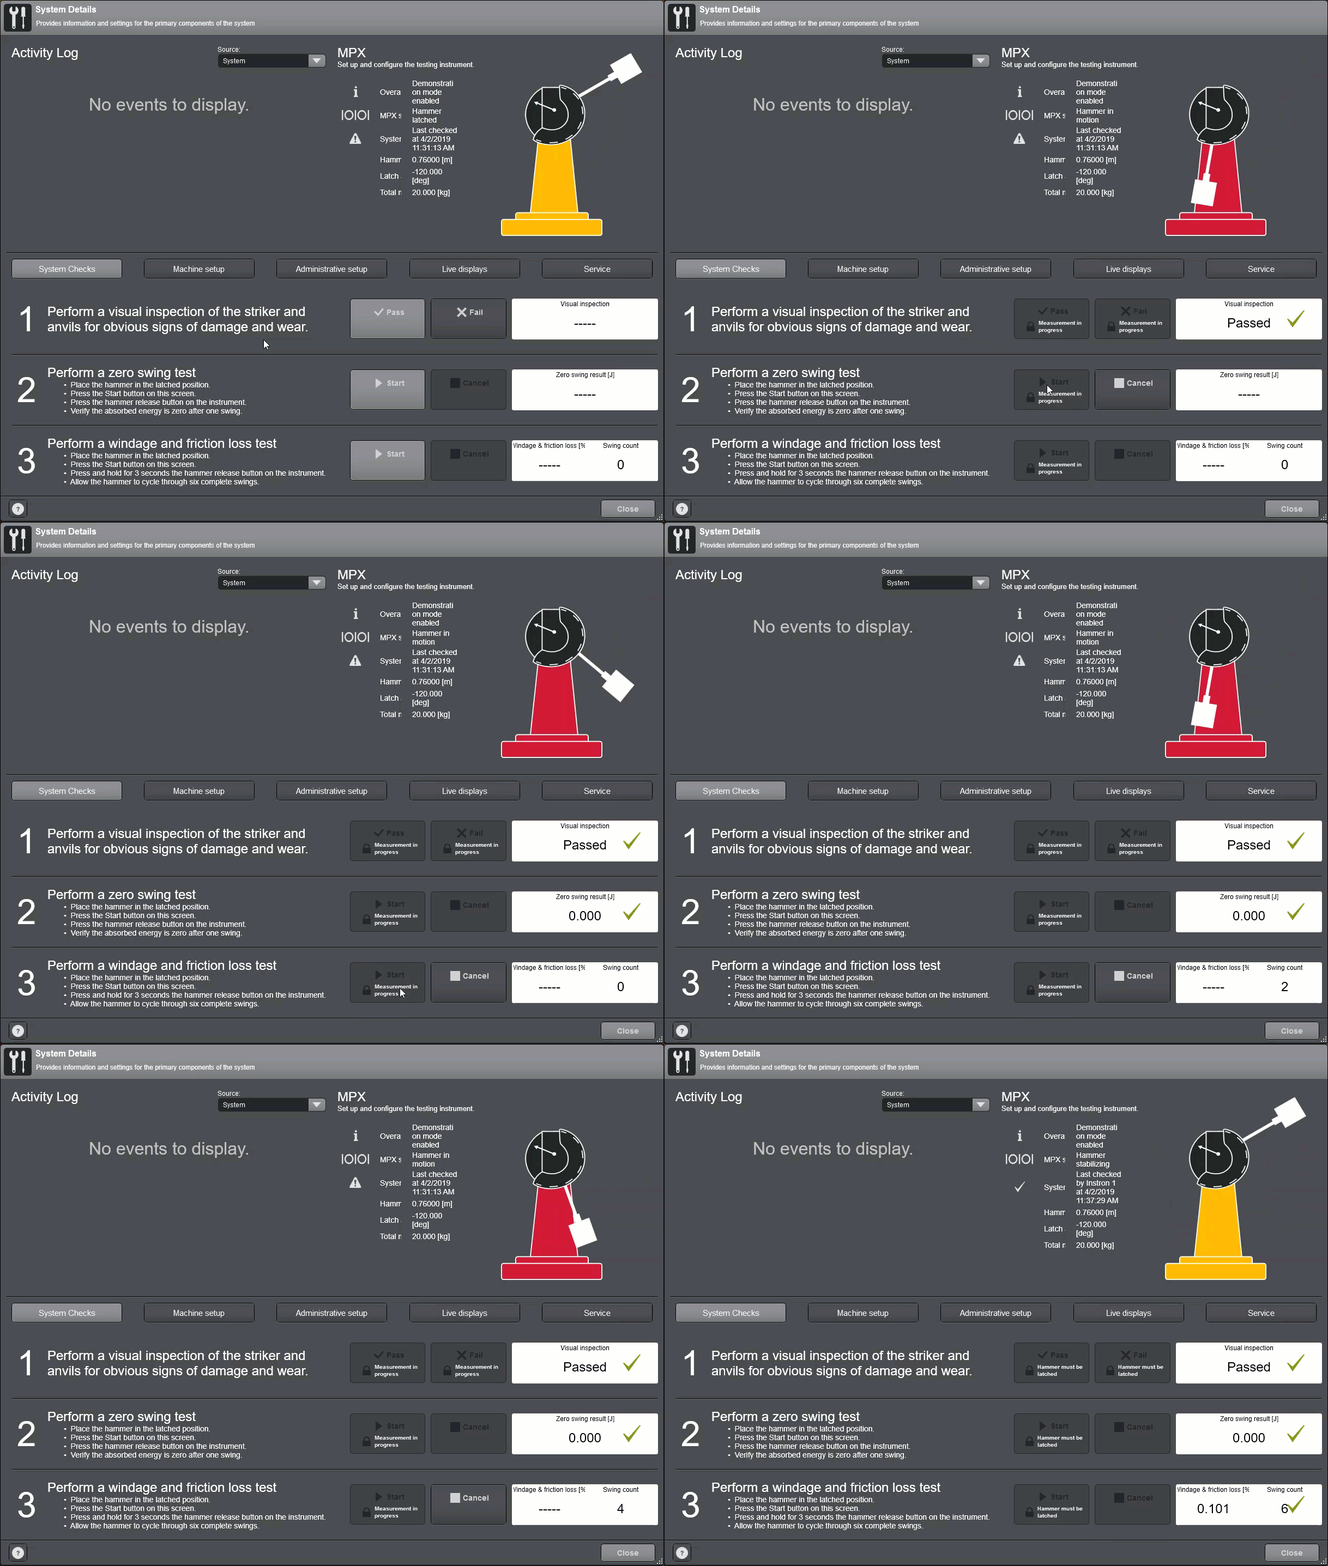
System Check
A simple 3 step process allows operators to perform system checks at chosen intervals.
- Visual Inspection
- Zero Friction Validation
- Windage and Friction Loss Test
Implementing this 3 step check for your operators will always ensure that testing is done correctly.
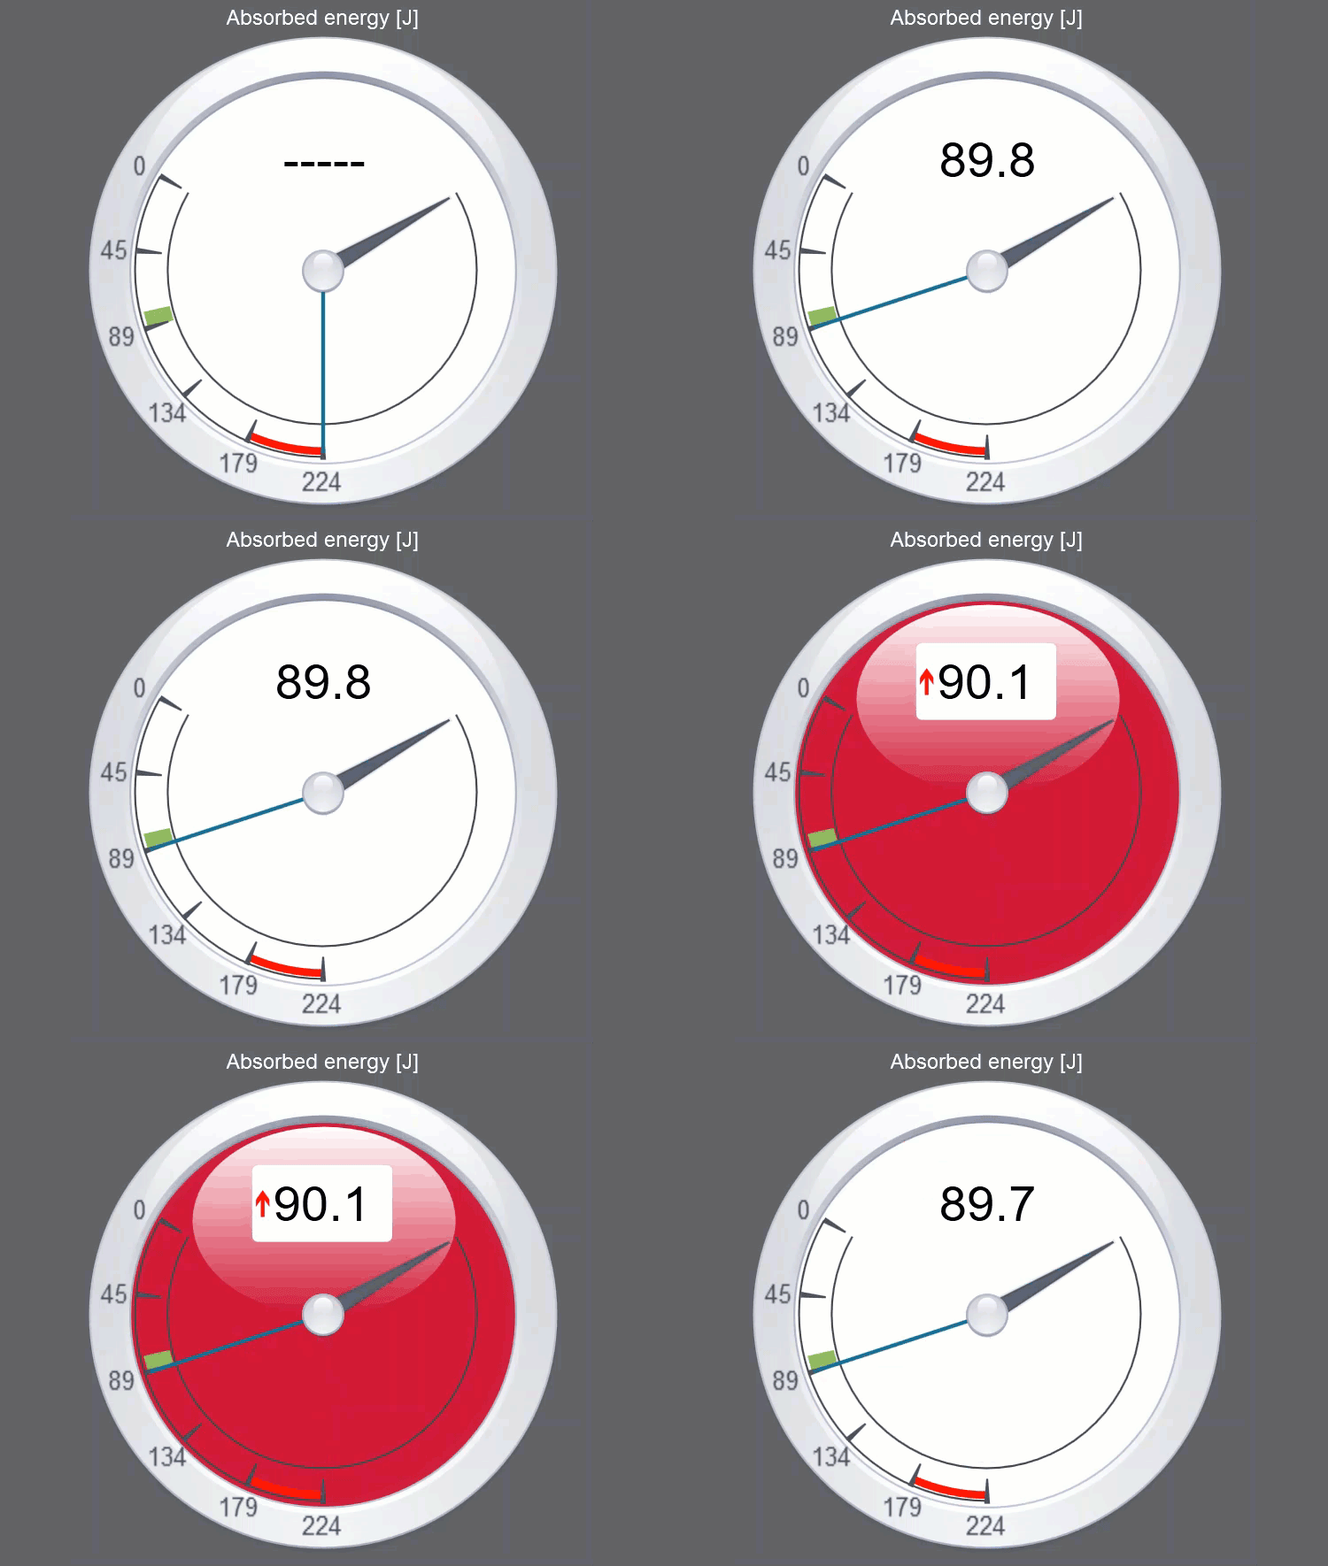
Real-Time Modern Dial
The real-time analog dial simulates the traditional style of reading impact energy and gives it a modern touch.
- Integrated digital reading of absorbed energy
- Arrow indicating current position of the pendulum
- Analog indication of the absorbed energy of the test
- To indicate a failed test, the dial turns red if the results fall outside of the user-defined acceptance range
- Acceptance criteria indicated visually on the data
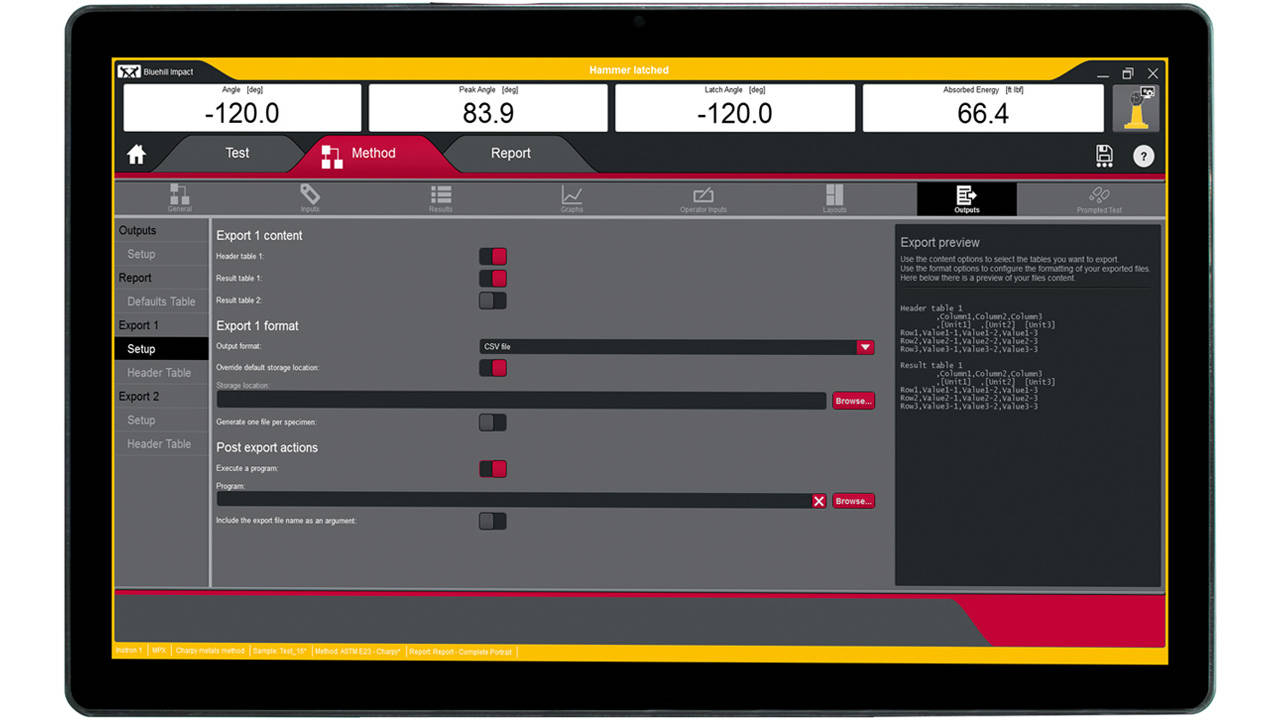
Advanced Data Exporting
Whether you need a polished PDF report or a customized file to integrate with your lab information management system, Bluehill Impact’s exporting tools have the flexibility to report results, user inputs, raw data, graphs, and other information.
TrendTracker
With the TrendTracker Viewer you can search Bluehill test specimens based on a specimen property, test parameter, or a calculation result. No more file-searching and copy-paste.
Automatic Exporting
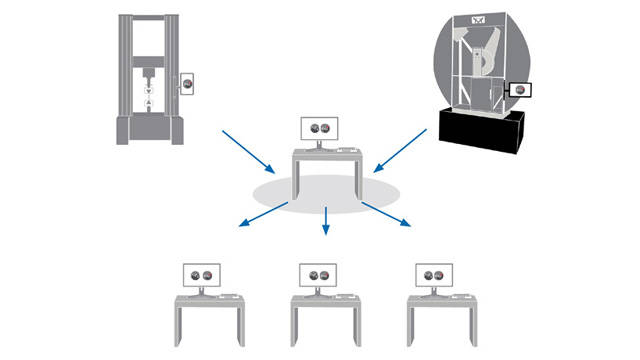
Bluehill Impact, Bluehill 3, and Bluehill Universal testing platforms can all be configured to automatically export various test parameters and results to a database at the end of each test. Your impact testing machine can be
connected to the same database as your universal testing machine, allowing users to search for data across different machines or even different labs.
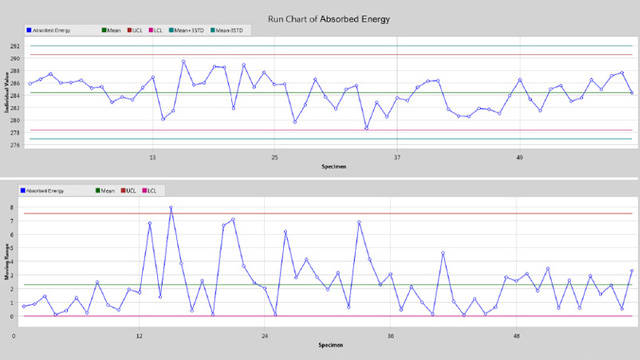
Sort, Group, and Visualize Trends
Within the tabular view you can group the data by any column by simply dragging the column header to the grouping area. You can also apply descriptive statistics like mean and standard deviation to subgroups, as well as to the entire dataset. Create control charts, like an Xbar-R or Xbar-S chart with right subsampling, and see how the product quality measures up against your specification limits.
